
NC Mid-Term 2026 Live Analysis
NC early voting tops 1.2 million as Republicans narrow their 2022 gap
North Carolina has reported 1,269,919 accepted early and mail ballots after eight calendar days of in-person voting, 37.3% ahead of the same stage in 2022.
The lead has held beyond opening weekend. The bigger change since Tuesday is within the electorate: Republican participation is approaching its 2022 pace, while Democrats and unaffiliated voters remain well above theirs.
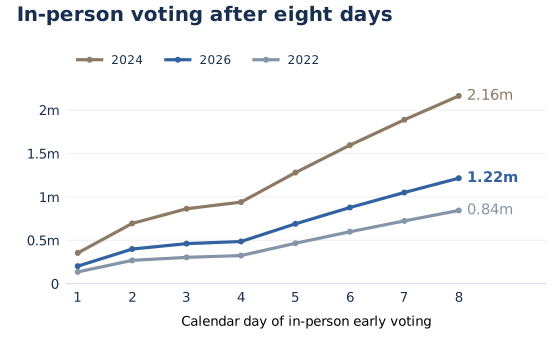
In-person voting keeps the midterm lead intact#
1,215,031 ballots came from early voting sites, up 44.1% from 842,986 at the equivalent 2022 cutoff. Accepted mail ballots remain 33.1% lower, at 54,888 versus 82,090.
The statewide count has grown by 536,620 since our October 20 report. In-person voting accounts for 525,898 of those net additions.
Registration growth does not explain the whole increase. Accepted ballots equal 16.10% of registered voters, versus 12.48% in 2022. Applying the old participation rate to today's registration total would produce about 984,350 ballots. The reported count is 29.0% above that benchmark.
Republicans are closing their 2022 participation gap#
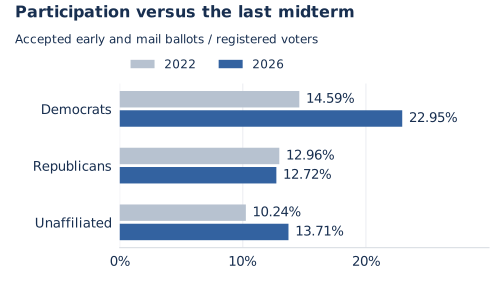
The Republican count is now 296,478, up 2.9% from the matching 2022 count. But Republican registration has also grown, so participation remains slightly below its old pace.
The rates within each registration group are:
- Democrats: 22.95%, versus 14.59% in 2022. Up 8.36 percentage points.
- Unaffiliated: 13.71%, versus 10.24%. Up 3.46 points.
- Republicans: 12.72%, versus 12.96%. Down 0.24 points.
In relative terms, those participation-rate changes are +57.3% for Democrats, +33.8% for unaffiliated voters, and −1.8% for Republicans. The Republican deficit was 9.3% in Tuesday's comparison.
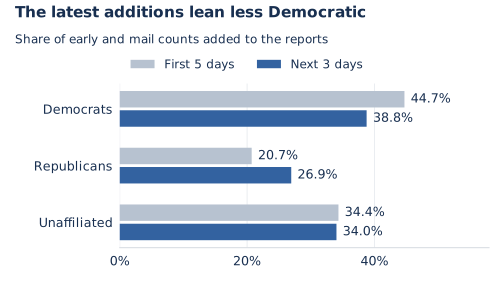
The latest additions are less Democratic than the opening count. Republicans account for 26.9% of net additions since Tuesday, compared with 20.7% of the earlier total. Their cumulative share has risen to 23.3%. The Democratic share has eased from 44.7% to 42.2%, while unaffiliated voters remain near 34.2%.
Democrats still added more ballots: 208,067, compared with 182,647 unaffiliated and 144,533 Republican. Their lead over Republicans in reported ballots grew from 175,960 to 239,494.
Unaffiliated ballot counts are 60.7% above 2022, but their participation rate is up 33.8%. The difference reflects a registration base that has grown 20.1%.
The presidential-year drop-off remains uneven#
Statewide participation has reached 54.7% of its rate at this point in 2024: 16.10% now, compared with 29.44% during that presidential election.
The midterm drop-off is much smaller among Democratic registrants:
- Democrats are at 72.5% of their 2024 participation rate: 22.95% now, versus 31.66% then.
- Unaffiliated voters are at 56.0%: 13.71% versus 24.48%.
- Republicans are at 37.5%: 12.72% versus 33.89%.
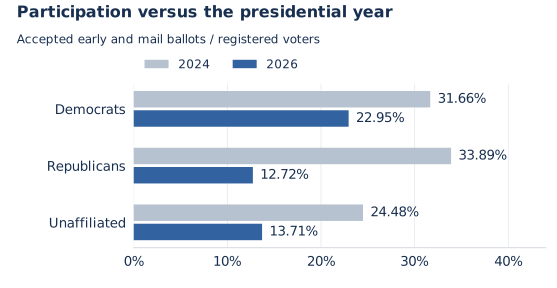
Republicans had the highest participation rate of the three groups at this stage in 2024. They currently have the lowest. Their share of accepted ballots is 11.0 percentage points below 2024, while the Democratic share is 8.6 points higher.
The increase now reaches 97 counties#
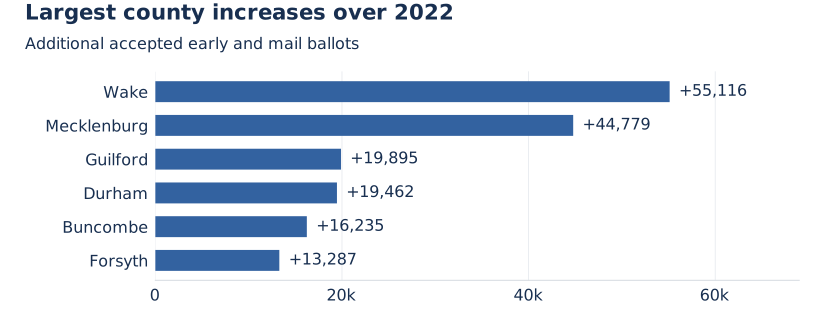
97 of 100 counties have more accepted ballots than at the matching 2022 cutoff, up from 94 in Tuesday's comparison. Alexander, Alleghany, and Columbus remain below their earlier counts.
Wake and Mecklenburg together account for 99,895 additional ballots, or 29.0% of the statewide net gain over 2022. Their counts are up 54.7% and 53.7%, respectively.
Black participation remains well above its 2022 pace#
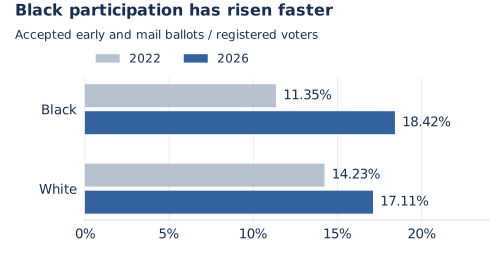
Black registrants account for 279,688 accepted ballots. Their participation rate is 18.42%, up from 11.35% in 2022, a gain of 7.07 percentage points. White participation is 17.11%, up from 14.23%, a gain of 2.88 points.
Against the presidential cycle, Black participation stands at 69.9% of its 2024 rate, compared with 51.8% for White registrants. Black voters supply 22.0% of reported ballots, versus 17.6% at this point in 2024.
Women account for 52.9% of accepted ballots. Their participation rate is 17.32%, compared with 16.19% for men. In the matching 2022 report, those rates were nearly equal at 12.95% and 13.01%.
What we'll be looking for over the weekend#
- Whether Republican participation moves above its 2022 rate. The gap has narrowed substantially since Tuesday.
- Whether the party mix continues to change. Watch each group's participation rate alongside its share of the growing total.
- Whether the presidential-year gaps narrow. The 2024 comparison still shows very different levels of early participation across affiliations.
- Whether the statewide lead holds as voting expands. County schedules and reporting changes can affect the next few daily counts.