
NC Mid-Term 2026 Live Analysis
NC mail voting trails 2022 as in-person voting approaches
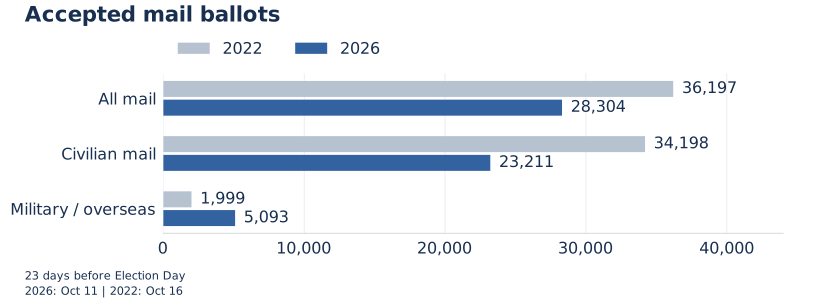
North Carolina has reported 28,304 accepted mail ballots, 21.8% fewer than at the same stage of the 2022 midterm. In-person early voting opens October 15.
Civilian mail voting accounts for the decline. Its count is down 32.1%, while military and overseas ballots have increased. Matching 2022's mail ballots per registered voter would put this year's count at 38,514. The reported count is 26.5% below that historical-rate benchmark.
Party participation is down across the three largest affiliations#
Registered Democrats have the highest mail participation rate so far. They account for 44.7% of accepted mail ballots, Republicans 16.7%, and unaffiliated voters 38.3%.
| Registration affiliation | Accepted mail ballots | Change from 2022 | Registered voters |
|---|---|---|---|
| Democratic | 12,645 | -30.3% | 2,331,884 |
| Republican | 4,736 | -19.9% | 2,330,767 |
| Unaffiliated | 10,848 | -10.0% | 3,168,841 |
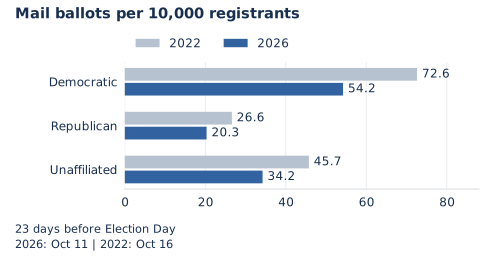
The count declines look quite different. After accounting for registration, all three groups' mail participation rates are roughly one-quarter below their own 2022 rates: 25.3% lower for Democrats, 23.6% for Republicans, and 25.2% for unaffiliated voters.
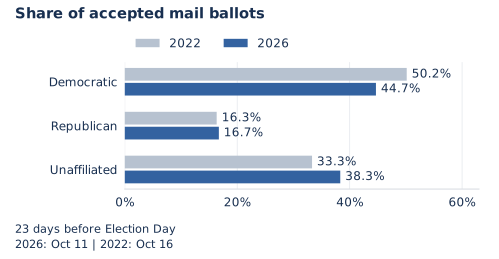
Unaffiliated voters' ballot share has risen five percentage points since 2022. Their registered population has also grown 20.2%. Their larger slice of the mail electorate comes alongside fewer accepted ballots and a lower participation rate within the group.
Overseas ballots have a different party mix.
| Registration affiliation | Civilian mail share | Overseas mail share |
|---|---|---|
| Democratic | 43.1% | 53.5% |
| Republican | 19.1% | 4.3% |
| Unaffiliated | 37.5% | 41.9% |
Overseas ballots are a larger part of this year's mail total, so their party mix affects the overall shares.
Who has voted, and where#
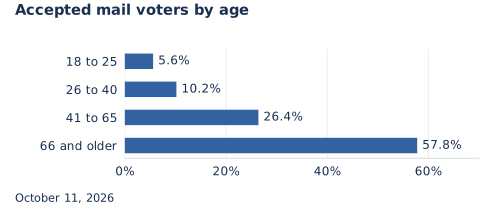
Voters aged 66 and older account for 57.8% of accepted mail ballots. Voters under 41 account for 15.8%.
The county picture varies. Guilford's accepted mail count is down 45.3%, Wake's 23.3%, and Mecklenburg's 27.9%. Buncombe is nearly level, up 0.4%. Across all 100 counties, 76 have fewer accepted mail ballots than at this stage in 2022, 21 have more, and three are unchanged.
The mail electorate's composition has also shifted. Military and overseas voters supply 18.0% of accepted mail ballots, compared with 5.5% in 2022. White registrants account for 74.1% of accepted ballots and Black registrants 9.6%, compared with 63.3% and 19.2% of registration respectively.
What we'll be looking for when in-person voting opens#
The archived 2022 reports show 135,391 in-person ballots after day one and 722,543 after seven days. Those opening days will give us a much larger electorate to analyze.
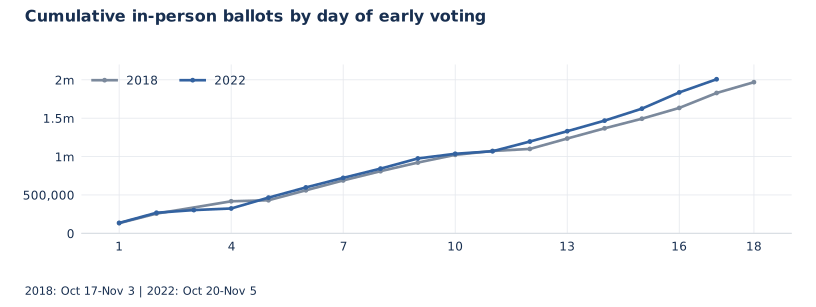
- The combined pace. Does in-person voting close the mail deficit? We will compare accepted ballots per registered voter with the same stage of prior midterms.
- Party participation. Do the mail patterns persist at early voting sites? We will track each affiliation's participation rate as well as its ballot share.
- The voter mix. How do age and racial composition change as people begin voting in person?
- County differences. Which counties gain ground, and how much reflects registration growth or delayed reporting?