
NC Mid-Term 2026 Live Analysis
NC early voting is 38% ahead of 2022
After the first five calendar days of in-person voting, 733,299 accepted ballots have been reported across early voting sites and mail, 38.3% more than at the same stage of the 2022 midterm.
The lead survives registration growth. Participation is 9.30% of registered voters, up from 7.15% in the matching 2022 report. At 2022's participation rate, today's registration total would produce about 564,196 ballots. The actual count is 30.0% above that benchmark.
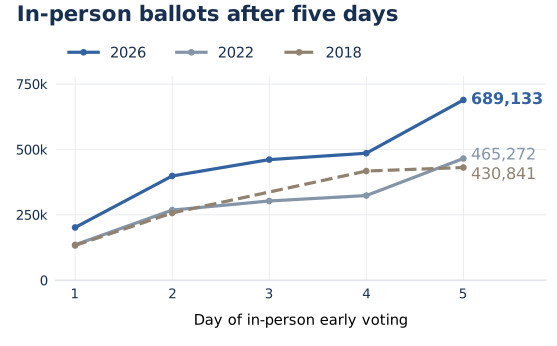
In-person voting has more than covered the mail deficit#
In-person voting accounts for 689,133 ballots, up 48.1% from 465,272 at the matching point in 2022. Mail ballots still trail by 32.0%, at 44,166 compared with 64,946.
In-person voting has added 223,861 ballots over 2022, offsetting the 20,780-ballot mail shortfall and producing a net lead of 203,081. The in-person lead was already visible after opening day and remains substantial after the first weekend and Monday.
Republican participation is below its 2022 pace#
Registered Democrats have supplied 327,905 ballots, unaffiliated voters 251,891, and Republicans 151,945.
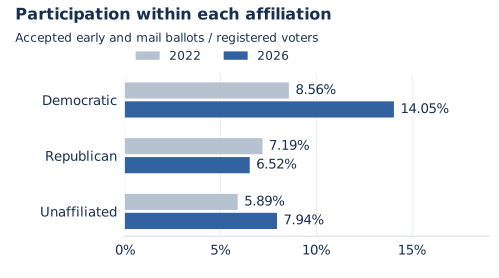
The share of each group's registered voters with an accepted early or mail ballot has changed since the matching 2022 cutoff:
- Democrats: 14.05%, up from 8.56%. An increase of 5.48 percentage points.
- Unaffiliated: 7.94%, up from 5.89%. An increase of 2.05 points.
- Republicans: 6.52%, down from 7.19%. A decline of 0.67 points.
The Democratic rate is 64.0% higher in relative terms. Democratic ballot counts rose 53.2%, while Democratic registration fell 6.6%. More ballots and a smaller registration base both contribute to the higher rate.
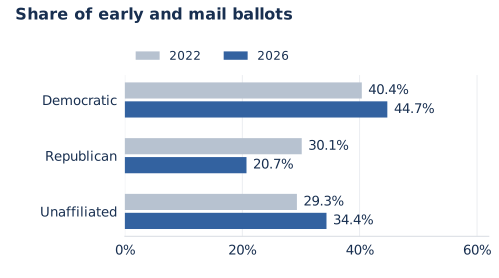
Democrats also lead at early voting sites. Democrats account for 44.8% of in-person ballots, unaffiliated voters 34.0%, and Republicans 20.9%.
Unaffiliated voters now supply a larger share of ballots than Republicans. Their 34.4% ballot share still falls short of their 40.2% share of registration. Democrats and Republicans each hold about 29.6% of registrations, but their reported participation rates are 14.05% and 6.52%, respectively.
Democrats are closer to their presidential-year pace#
Compared with the same first five calendar days of in-person voting in the 2024 presidential election, statewide participation is 9.30% versus 17.73%. This midterm has reached 52.5% of the presidential-year participation rate, with a much smaller drop among Democrats than Republicans.
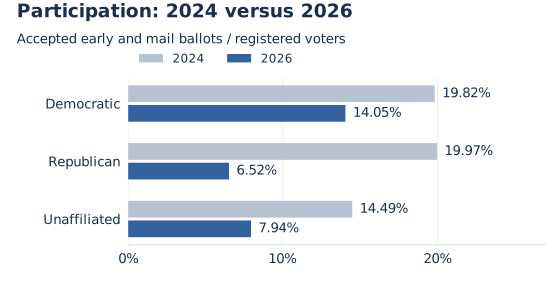
- Democratic participation is at 70.9% of its 2024 rate. It has fallen from 19.82% to 14.05%, a decline of 5.77 percentage points.
- Unaffiliated participation is at 54.8%. It has fallen from 14.49% to 7.94%, down 6.55 points.
- Republican participation is at 32.7%. It has fallen from 19.97% to 6.52%, down 13.45 points.
The composition has shifted, too. Democrats supplied 35.0% of ballots at this stage in 2024 and supply 44.7% now, a gain of 9.7 percentage points. The Republican share has fallen from 33.6% to 20.7%, down 12.9 points. The unaffiliated share has risen from 31.0% to 34.4%, up 3.4 points.
Democrats and Republicans had almost identical participation rates at this point in 2024. Today, the Democratic rate is more than twice the Republican rate.
The increase reaches 94 counties#
94 of North Carolina's 100 counties have more accepted ballots than at the matching point in 2022. Wake and Mecklenburg have added 61,386 ballots between them, accounting for 30.2% of the statewide net increase.
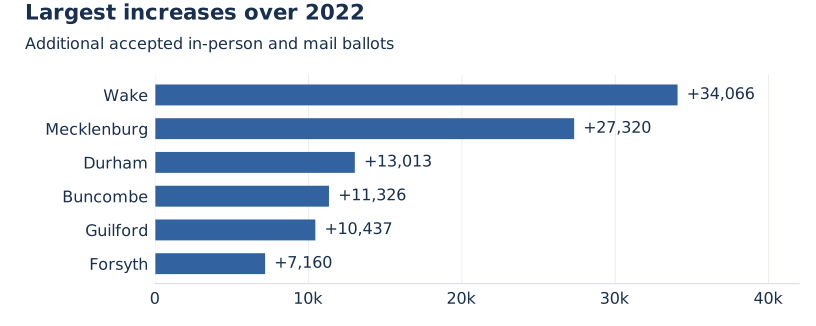
Among those six counties, Buncombe's count is up 67.0%, Durham's 60.3%, and Wake's 55.1%. The six counties below their 2022 counts are Alexander, Alleghany, Columbus, Gates, Randolph, and Rowan. Alexander and Columbus have the largest percentage declines, at 28.3% and 27.0%.
Black participation has risen faster than White participation#
Black registrants have returned or cast 168,406 accepted ballots, up from 98,978 in the matching 2022 report. Their participation rate has risen from 6.57% to 11.09%. White registrants' rate has risen from 8.11% to 9.73%.
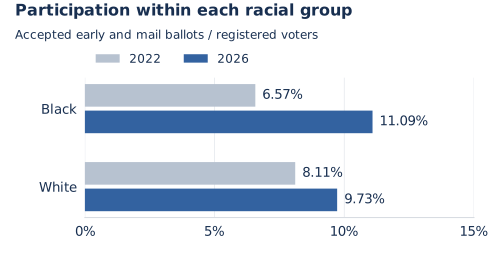
Black voters account for 23.0% of reported ballots, compared with 18.7% at this stage in 2022.
Against 2024, Black participation is at 66.4% of its presidential-year rate: 11.09% now versus 16.71% then. White participation is at 49.5% of its 2024 rate: 9.73% versus 19.66%. Black voters' share of ballots is 4.4 percentage points higher than in 2024, even though fewer Black voters have voted so far.
The electorate remains older. Voters 66 and older account for 49.2% of all accepted ballots. At in-person sites, voters aged 41 to 65 supply 36.5% of ballots, compared with 26.8% of mail ballots. Voters under 41 account for 14.7% in person and 17.7% by mail.
What we'll be looking for next#
- Whether the lead holds through the first full week. The next comparison will show whether the opening surge becomes a sustained participation advantage over 2022.
- Whether the presidential-cycle gaps narrow. Track each affiliation's rate against both 2024 and 2022, alongside its share of ballots.
- Whether county differences persist. Additional reporting days will help distinguish durable gaps from differences in site schedules and processing.
- How the voter mix changes. Track whether the current age and racial patterns continue as the cumulative electorate grows.