Skip to content

State of the Midterms 2026: Texas

Texas early voting reaches 3.72 million in its first five days

Texas reported 3.72 million early votes through Friday, October 23, the first five days of in-person voting. Participation is well above the last midterm, and counties Kamala Harris carried in 2024 account for a larger share of the early electorate.

19.56% of registered voters have participated, compared with 14.23% at the matching point in 2022. That is a 5.33 percentage-point increase, or 37.4% in relative terms. Texas has reached 80.8% of its matched 2024 participation rate.
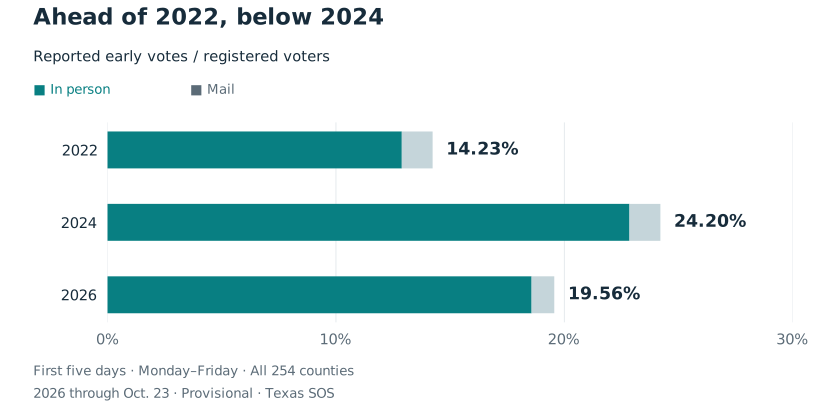
Reported early votes divided by registered voters after five days: 14.23 percent in 2022, 24.20 percent in 2024 and 19.56 percent in 2026. Bars separate in-person voting and mail.

In-person voting drives the increase#

3,535,211 reported votes came from early-voting sites, nearly 95% of the total. Mail accounts for 189,079.

Compared with the same point in 2022, Texas has reported 1.26 million more in-person votes and about 49,000 fewer mail votes. The overall count is up 48.1%. Accounting for registration growth reduces that increase to 37.4%.

The gains are widespread: 215 of 254 counties have a higher reported participation rate than at the matched 2022 cutoff.

ElectionReported early and mail votesRegistrationParticipation
2022 midterm2,515,15617,672,14314.23%
2024 presidential4,507,73318,623,93124.20%
2026 midterm3,724,29019,041,68419.56%

The early electorate has a different geographic mix#

In the 12 counties Harris carried in 2024, participation has reached 89.5% of the matched presidential-year rate. In the 242 counties Trump carried, it has reached 75.5%.

Both groups are ahead of 2022. The registration-adjusted increases are 48.3% in Harris-won counties and 30.5% in Trump-won counties.
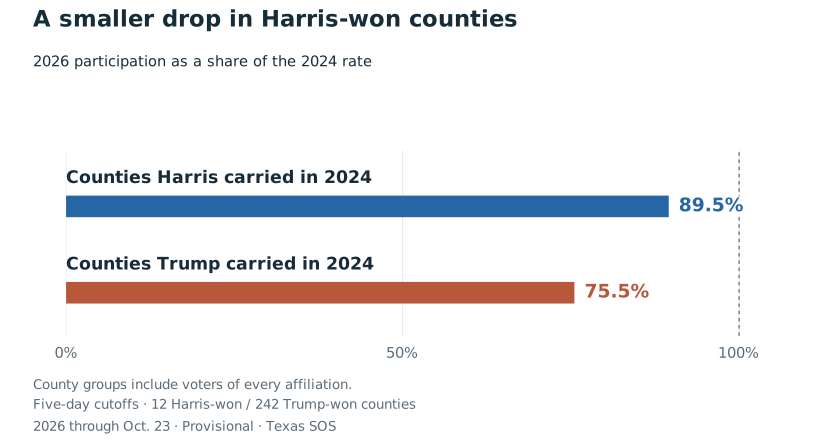
Counties Harris carried in 2024 have reached 89.5 percent of their matched 2024 participation rate. Counties Trump carried have reached 75.5 percent. Both groups include voters supporting different parties.

Their current participation rates are close: 19.81% and 19.38%, respectively. The larger gap in the presidential comparison reflects higher participation in Trump-won counties at this stage in 2024.

Harris-won counties now supply 41.8% of reported early votes, up from 37.7% at the matching 2024 point. That changes the geographic composition of the early electorate. It does not identify which candidates those voters support.

Dallas has passed its 2024 participation rate#

Dallas is at 21.10% of registered voters, compared with 20.08% at the matching 2024 cutoff. Its current rate is 105.1% of that presidential-year benchmark.

Travis is at 90.4% of its 2024 rate and Harris County at 81.9%. Collin and Denton are further below, at 76.0% and 70.6%.

The pattern crosses party geography. Hidalgo, which Trump carried in 2024, is at 97.5% of its presidential-year rate. Tarrant is at 91.2%.
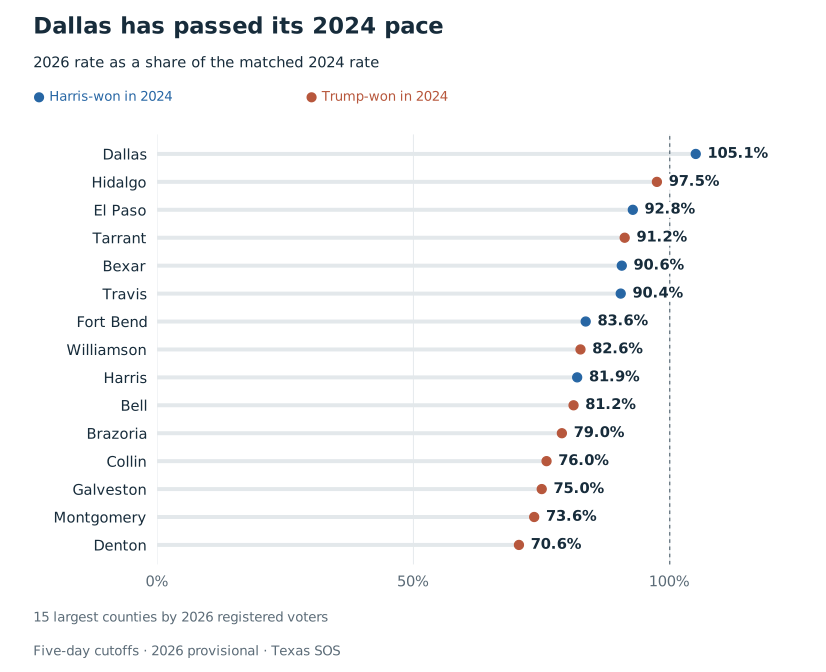
The 15 largest Texas counties ranked by 2026 participation as a share of the matched 2024 rate. Dallas leads at 105.1 percent, followed by Hidalgo at 97.5 percent and El Paso at 92.8 percent. Denton is at 70.6 percent.

What this means for the Senate race#

Democrat James Talarico and Republican Ken Paxton are competing in a closely polled race. The University of Houston's October 10–14 survey put them at 48% and 46%, with Libertarian Ted Brown at 3% and 3% unsure.

The turnout figures show where participation is strongest relative to earlier elections. They cannot establish a candidate's lead. Texas does not register voters by party, and every county contains voters supporting different candidates.

What we'll watch next#

  • Whether the geographic shift holds as weekend reports catch up and the final week brings more voters into the count.
  • Whether suburban counties close their 2024 gaps. Collin, Denton and Montgomery remain below the statewide presidential-year comparison.
  • Whether higher early participation becomes higher final turnout. These totals cannot separate additional voters from people voting earlier.

Sources and notes#

Published October 26, 2026. This edition uses the official state table captured Monday morning for voting reported through Friday, October 23. The figures are provisional. It is a first-week comparison, not a complete weekend count.

Matched windows: each comparison covers the first five calendar days of in-person voting, Monday through Friday, ending 11 days before Election Day. Mail totals include ballots received before in-person voting opened. Matching windows does not equalize site counts, opening hours or reporting delays.

ElectionIn-person voting openedReporting cutoffElection Day
2022October 24October 28November 8
2024October 21October 25November 5
2026October 19October 23November 3
  • Turnout and registration: Texas Secretary of State October 23, 2026 county table and 2022 and 2024 archive. Select the November general election and the cutoff above. All 254 counties are included and sum to the published statewide totals. Reader data: statewide, county and geographic comparisons.
  • Why Friday: state weekend uploads were still lagging county reports on October 26. The Harris County report showed 40,865 Sunday in-person check-ins while the state Sunday row initially showed zero and later two. We preserve the earlier common cutoff instead of mixing newer county totals into it. Nine counties also had zero daily in-person entries for Friday; those entries do not prove nobody voted. Historical archives have had more time for reconciliation than current reports. The live Friday page returned no data during a later publication check; the preserved morning table supplies this edition's figures.
  • Calculations: participation equals reported cumulative in-person and mail voters divided by that year's registration total. Relative changes compare these rates. Geographic group rates use summed votes divided by summed registration, not averages of county percentages. Ratios do not measure individual voters returning or forecast final turnout.
  • Provisional counts: county check-ins, mail receipts and state uploads can differ during reconciliation. Mail receipts are not necessarily ballots approved for counting. See Fort Bend's reporting explanation.
  • Geographic groups: the winner in the official 2024 presidential county results determines each county's group. These are totals across all voters, not party turnout. Texas does not register voters by party.
  • Senate context: certified ballot and University of Houston Hobby School survey, October 10–14, 2,000 likely voters. The reported margin of error is ±2.19 percentage points for the full sample. The two-point gap does not establish a clear lead, and sampling error is only one source of polling uncertainty.
  • Election calendars: official 2022 dates, 2024 dates and 2026 election information. In-person early voting ends October 30. Election Day is November 3.

Follow our North Carolina series for its separate party-registration and demographic analysis.